Draft — unlisted preview, not indexed
Online HVAC and energy monitoring: the advantage is not the chart
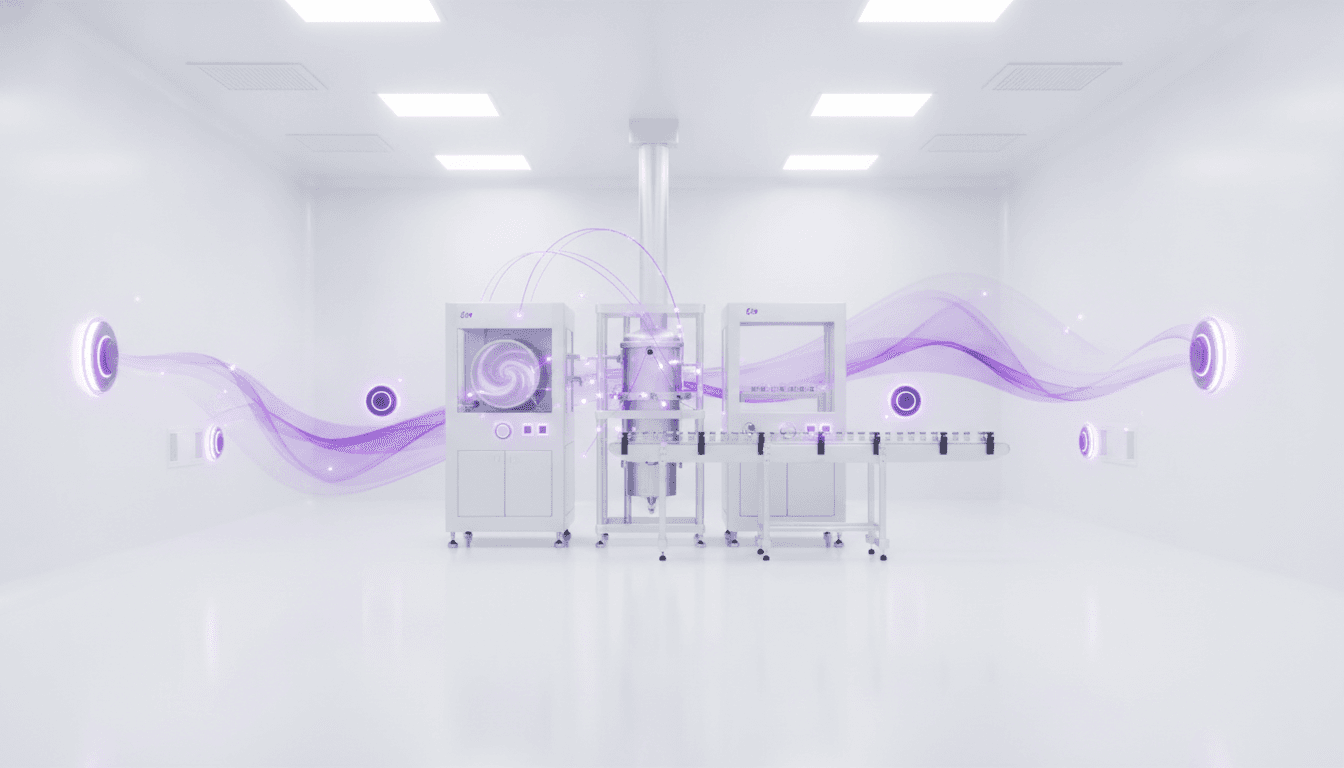

In a pharmaceutical plant, HVAC is not comfort. It is a process condition: temperature, humidity, ventilation and, where the design requires it, pressure and filtration. RDC 658/2022 is direct on this point — lighting, temperature, humidity and ventilation must be adequate and must not prejudice, directly or indirectly, medicinal products during manufacture and storage, nor the precise functioning of equipment (art. 67); production areas need appropriate air treatment, including temperature and, when necessary, humidity and filtration (art. 79); and where storage requires a special condition, temperature and humidity must be provided, checked and monitored (art. 86).
What the regulation does not solve alone is the gap between two manual readings. That is where online monitoring with sensors stops being a “panel upgrade” and becomes an operational advantage — if the design is honest.
What “online” actually changes
A spot reading with a thermo-hygrometer or a shift round captures an instant. Continuous monitoring captures the trajectory.
Three practical advantages show up when sensors feed a system with alarm, trend and trail:
- The excursion stops being a release surprise. A temperature drift at three in the morning does not wait for the eight o’clock spreadsheet. Alert and action can happen while the material is still under the condition — not only in the next day’s reconciliation.
- Trend replaces impression. “The room is stable” becomes a curve, not shift opinion. Slow humidity drifts, filter loading (via differential pressure) or odd chiller behaviour show up before the dry alarm.
- The batch gains context. When the HVAC event is time-stamped and tied to area and time window, deviation investigation stops hunting notebooks. It starts asking what the environment did while the batch was there.
A sensor without an alarm and without an owner is only a larger file. The advantage is the moment of control.
HVAC and energy on the same wire — why
Separating “air quality” from “the energy bill” is comfortable on the org chart and expensive on the plant. Both share the same machine: fans, coils, dampers, setpoints, operating schedules.
Monitoring energy (power, kWh per AHU, load factor, peaks) together with environmental parameters often reveals what the HVAC SOP alone does not show:
- an aggressive setpoint or unnecessary reheat that stabilises the room while paying for consumption nobody asked for
- a loading filter (pressure rises) and the fan compensating — environmental signal and energy signal in the same episode
- a room “ok” on the shift with equipment in inefficient mode the rest of the day, because nobody watched continuous consumption
- a partial utility failure masked: temperature still inside the limit, but the system already at the edge of capacity
The advantage here is not brochure ESG. It is diagnosis: the same deviation that threatens the medicinal product often leaves traces in amps and kWh hours earlier.
What the sensor must deliver to be worth GxP
Cheap hardware and a pretty dashboard are not enough. In a regulated environment, value appears when:
- the measurement has an auditable origin — time stamp, point identity, data quality; not late typing of the display value
- alert and action limits are defined where they make sense — and someone owns the response
- calibration and sensor status enter readiness — a “blind” or overdue point cannot pretend the room is covered
- history survives the two-year question — what the room did for that batch, in that interval
This is the same shift already discussed in environmental monitoring and in resource readiness: the system only helps if the limit sits in the flow, not if the qualification PDF is the only evidence. On NEO, continuous utility and sensor data often sit with NEO PI.
Advantages operations feel (without romance)
When the design closes, the plant usually gains four concrete things:
- Fewer “no root cause” deviations. An excursion with curve and context kills vague hypotheses.
- Less over-reaction. A stable trend reduces false positives that trigger investigation from a single-point reading error.
- Evidence-led maintenance. Filter change, setpoint tune and chiller intervention stop being a blind calendar.
- Waste cut without loosening the quality limit. Energy shows where the utility works too hard to hold the same specification — or where the specification is being “bought” with avoidable consumption.
What online monitoring does not solve
It does not replace area qualification or an inadequate HVAC design. It does not turn a poorly balanced room into a good one — it only shows the failure earlier. It does not authorise ignoring viable/non-viable sampling where the process requires it: online temperature and humidity are not a substitute for particle or microbiology monitoring.
It also does not create data integrity alone. If the historian accepts overwrite, if the alarm vanishes without a record, or if the sensor is out of calibration, “online” only accelerates a fiction.
Questions before calling the project an advantage
- Are critical temperature/humidity/pressure points (and energy of the relevant AHUs) covered continuously — or only the “VIP” rooms?
- Do alert and action have an owner and response time, or does the alarm ring into empty space?
- Does an excursion generate evidence tied to batch/area/interval, or only a screen print?
- Do calibration and sensor failure take the point out of “coverage”, or does the plant pretend the chart still counts?
- Are HVAC and energy read together in investigation — or does each team look at its own piece?
That last question usually separates a sensor project from a control project.
Online HVAC and energy monitoring with sensors is worth it when it stops being a panel and becomes a detection and control layer: it sees the drift early, explains the deviation with context and shows the cost of holding (or pretending to hold) the condition. The advantage is not the chart. It is the minute when action is still possible.
In your plant, was the last temperature excursion found by the alarm — or by the next day’s spreadsheet?
Practical writing on GxP, MES, data integrity and shop-floor systems. A few times a month, no noise.