A digital twin of the plant: from the alarm on screen to the investigated deviation
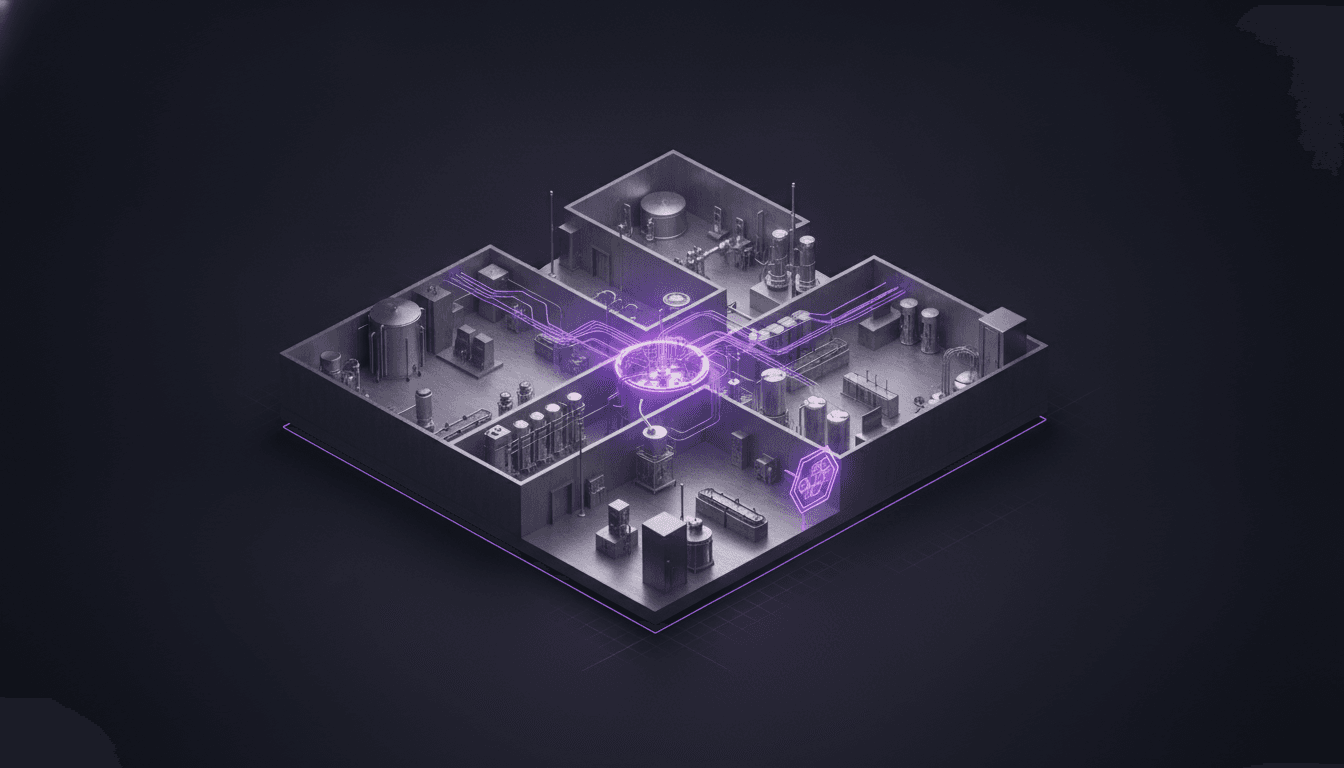
A pharmaceutical control room does not lack data. A single building often carries hundreds of measurement points: room temperature and humidity, differential pressure between areas, product temperature in tanks and reactors, door states. What tends to be missing is two different things, and it helps to separate them from the start.
The first is seeing: noticing, in time, which of those readings left its limit and where it sits in the plant. The second is recording the response: days later, when the deviation investigation starts, being able to show what happened, when, who saw it, what was done and which batch was in production. Many monitoring tools handle the first well. The second tends to be assembled afterwards from exports, screenshots and shift notes.
NEO Digital Twin, the new module of T2 Software's NEO platform, was designed to handle both in one place: a 3D model of the plant with live values, and an alarm lifecycle that leaves a record at every step.
From the floor plan to the model
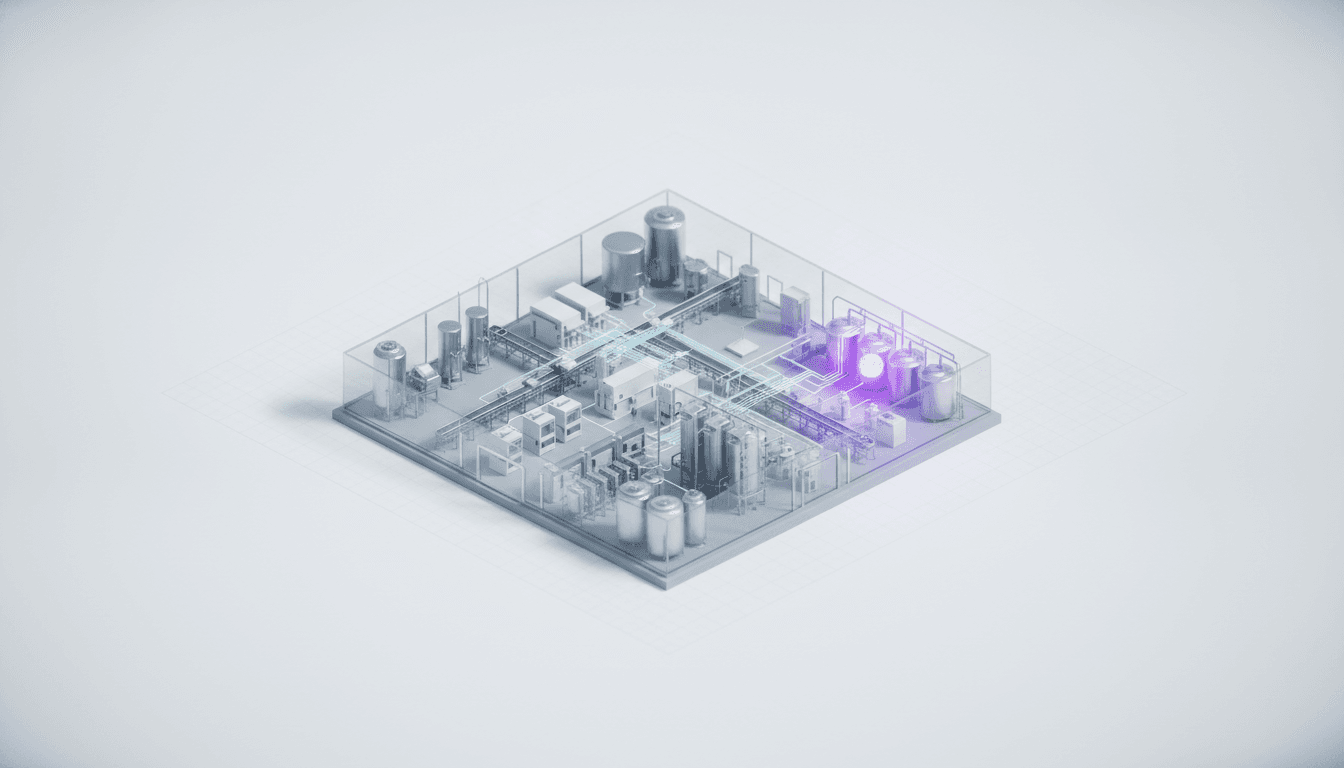
The model follows the hierarchy the plant already uses: site, building, area, room, equipment and measurement points. Engineering builds it in the editor on top of the floor plan, which can come in as an image, PDF, DXF or IFC, and picks equipment from a catalogue of 20 types, such as reactor, tablet press, granulator, autoclave, isolator and tank, plus sensors for temperature and humidity, differential pressure, door contact and particle counts. Each type comes with its default points and limits.
To avoid starting from scratch, the editor can generate a draft from the floor-plan image: rooms, walls, doors and scale. On a typical plan this takes 20 to 60 seconds. The draft is overlaid on the drawing for review; engineering checks the scale, adjusts what is needed and only then accepts it. Door detection is the least accurate part and usually needs manual correction. The feature only works if the plant enables it, and it sends only the floor-plan image to the external model provider; nothing else about the plant leaves the server.
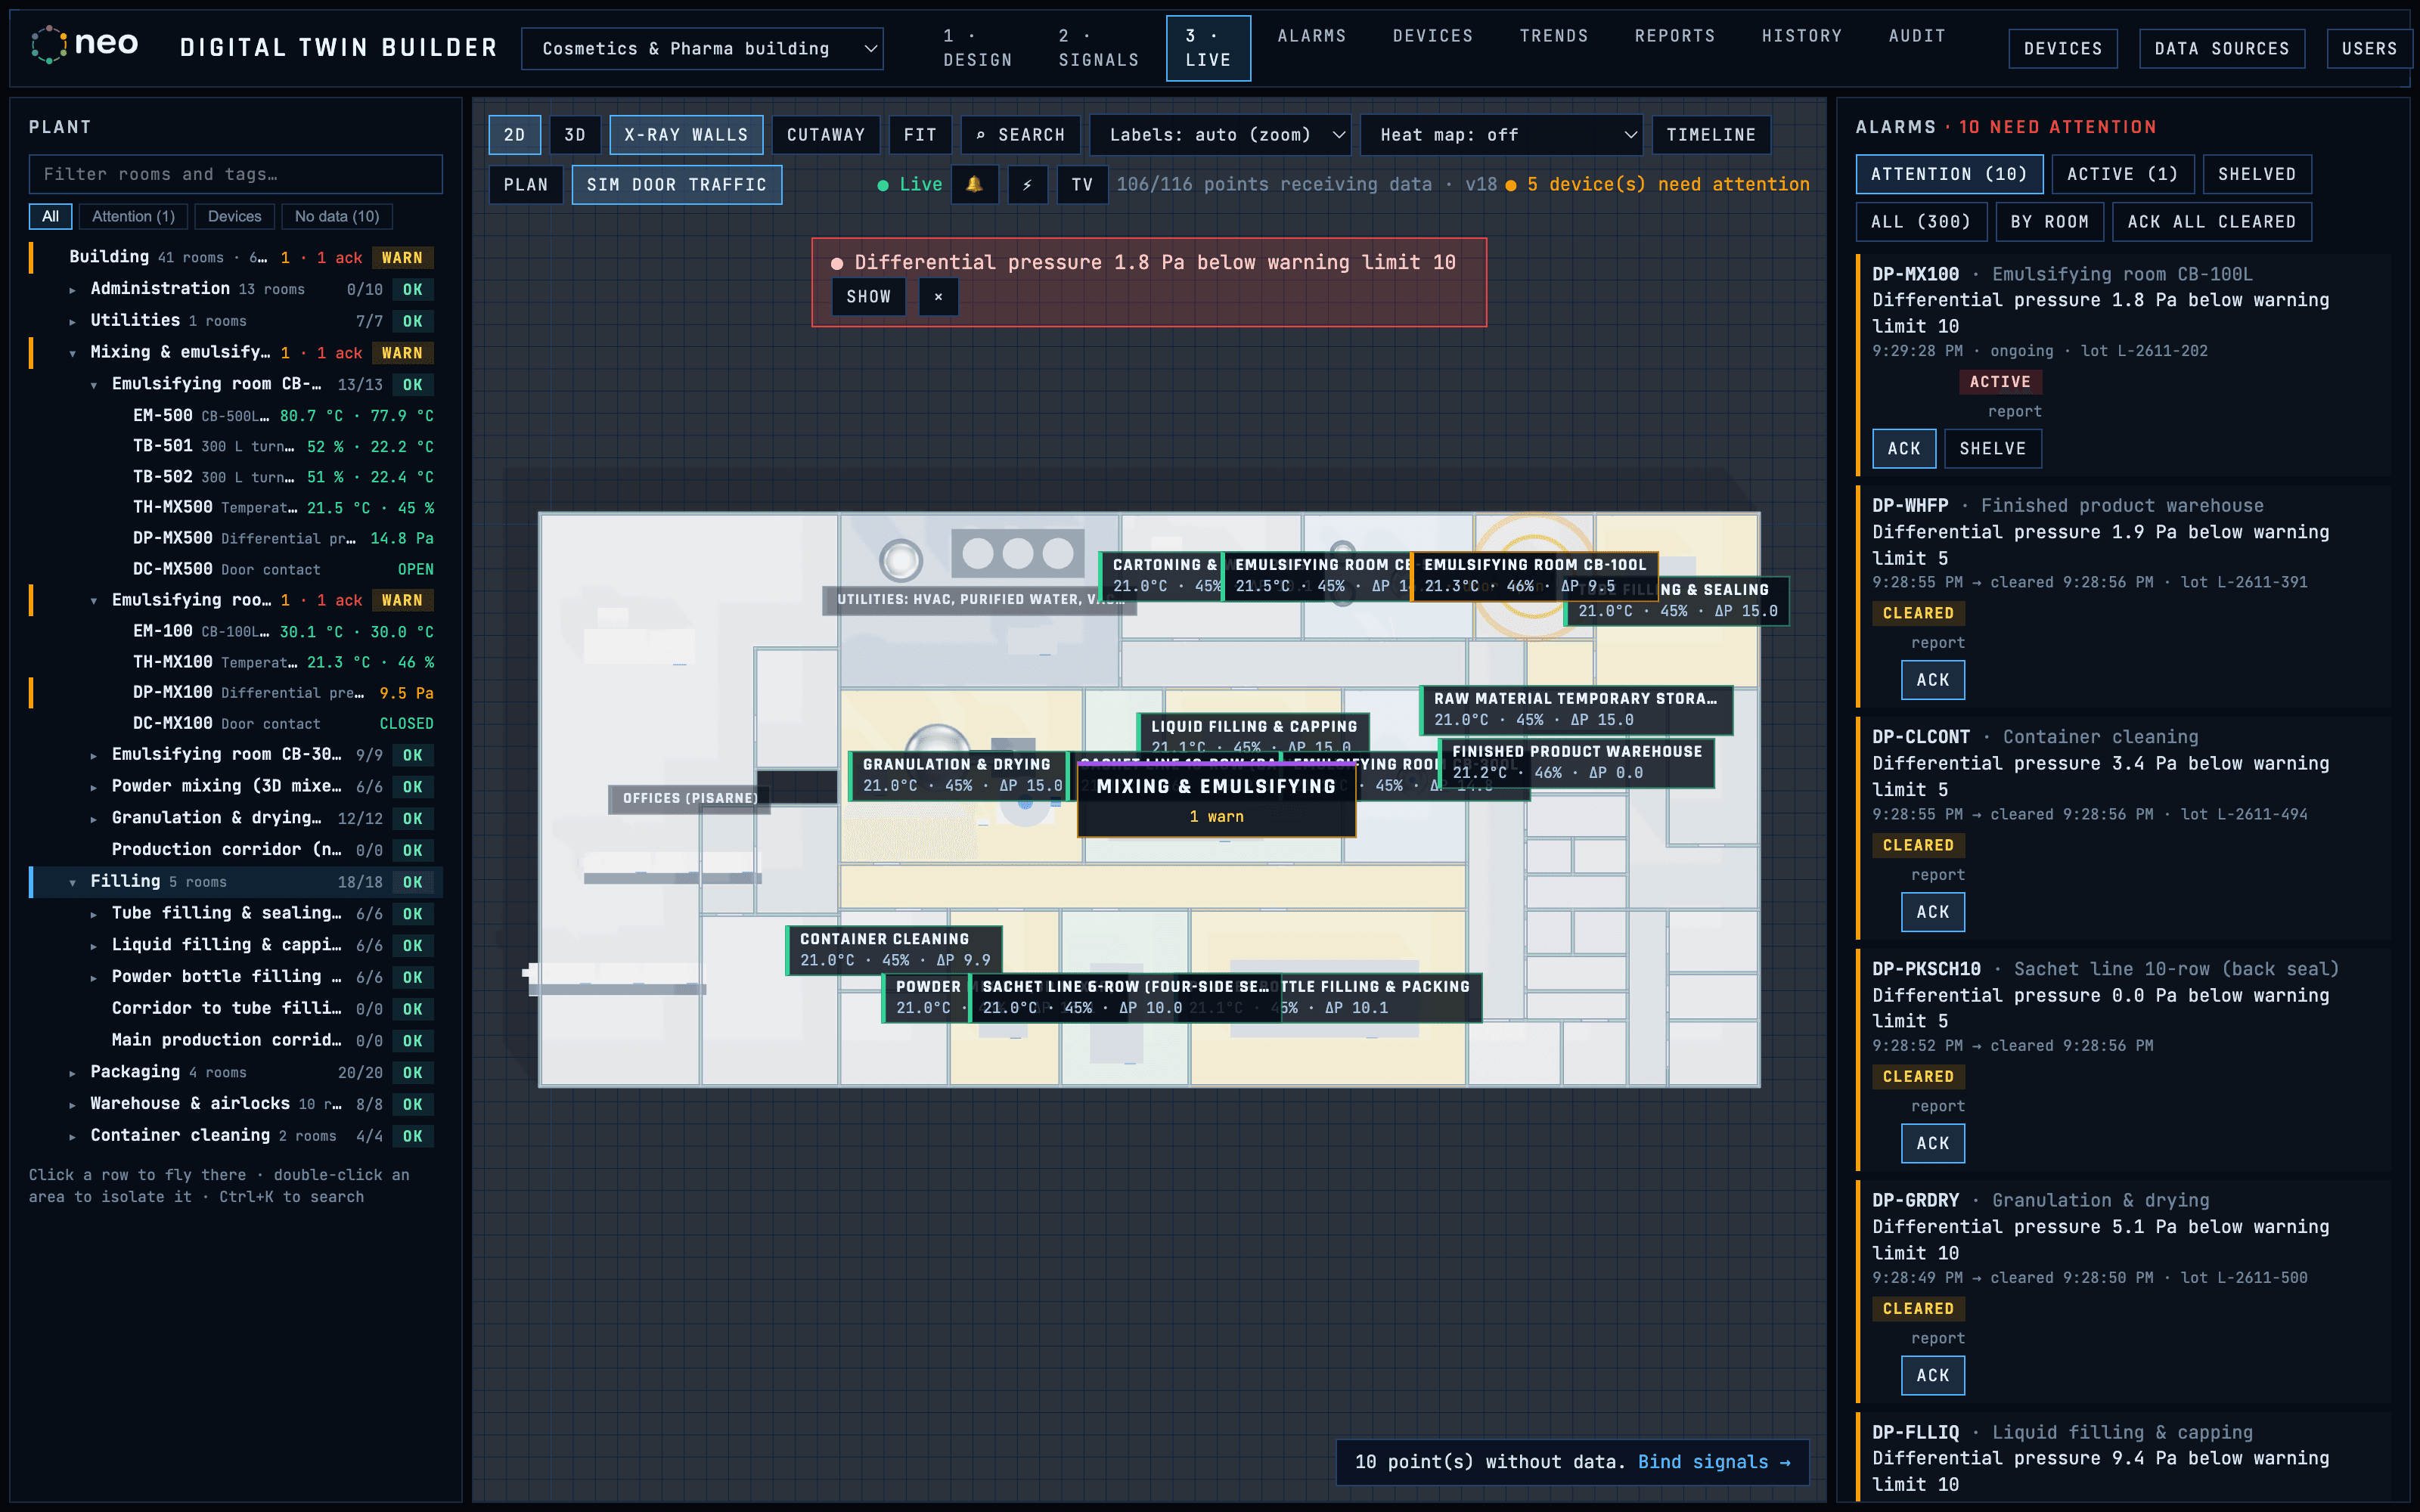
2D view of the model, with the rooms and the live values.
Signals the plant already has
NEO Digital Twin receives data over MQTT. It reads ChirpStack (LoRaWAN), Advantech WISE and generic JSON payloads, and binds each sensor to its point in the model automatically by device identifier. The module's server is the only client of the broker; browsers never connect to it directly.
An important distinction shows up here: a process alarm is not sensor health. A sensor that stopped reporting, has been silent for a day or has a battery below 20% appears in its own list, separate from process alarms. Mixing the two tends to produce alarms nobody can investigate.
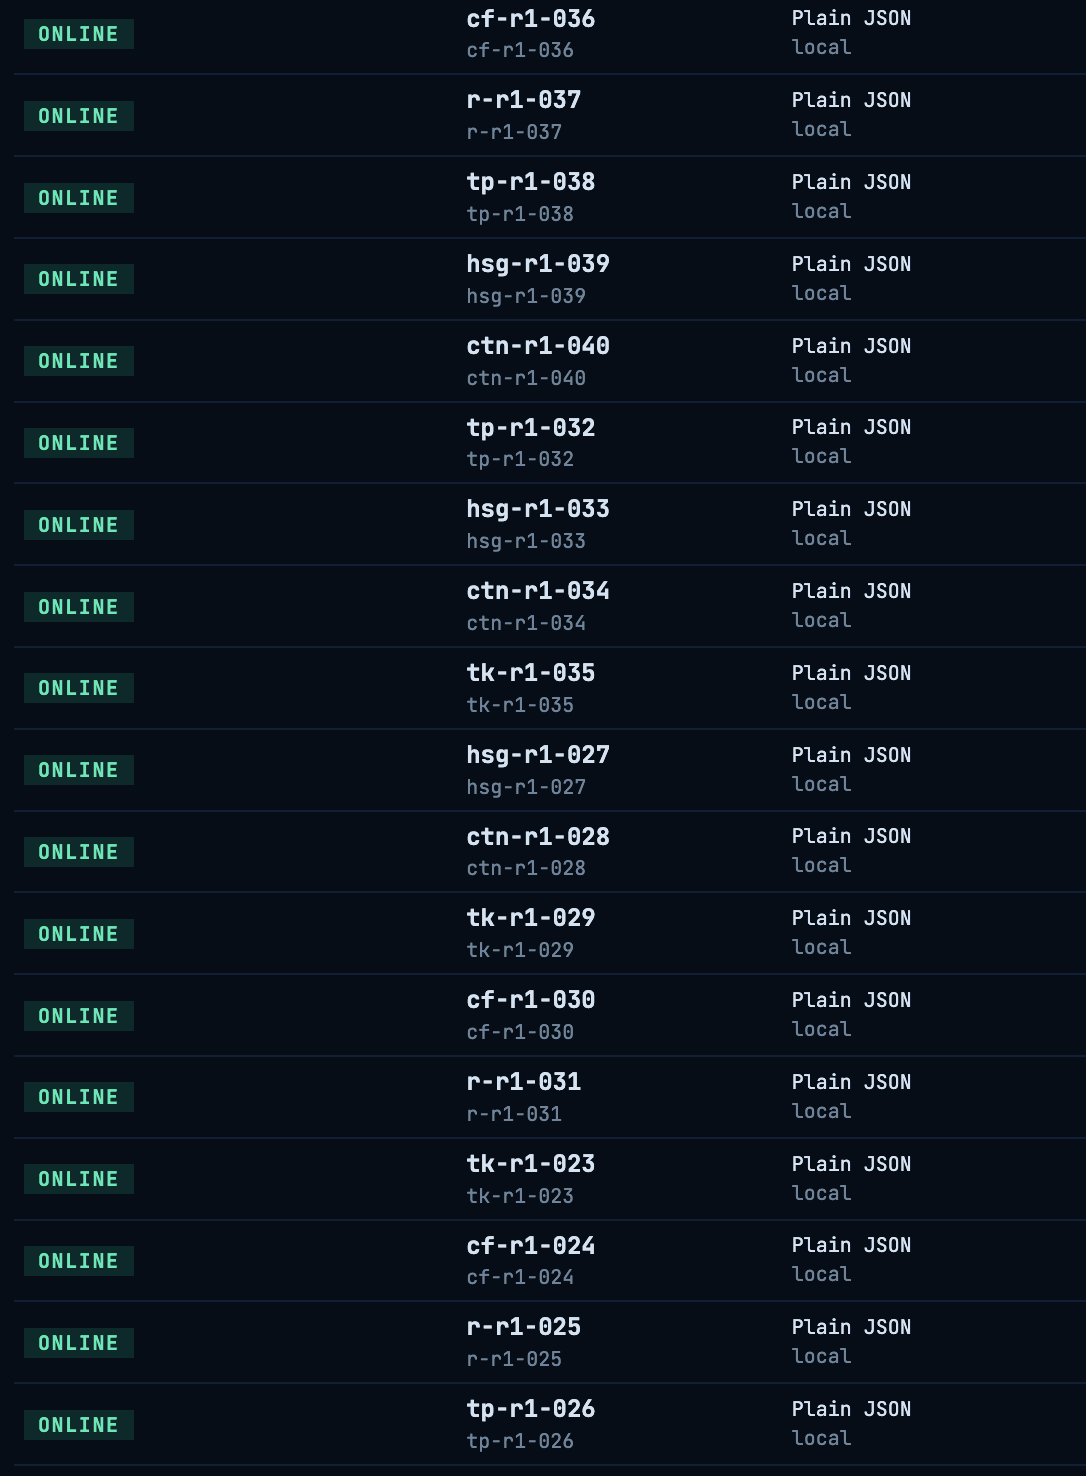
Devices received by the module and bound to their point in the model.
Management by exception
On screen, the worst status rolls up from room to area, building and site. The person in the control room does not need to go through rooms one by one: the room in warning turns yellow in 3D and, with one click on the alarm, the camera flies to the equipment. In the toolbar, the «X-ray walls» function makes walls transparent so you can see inside rooms without moving the camera. The same model offers a 2D view, trends from 1 hour to 30 days, a heat map interpolated between sensors and a timeline to replay the last 30 days.
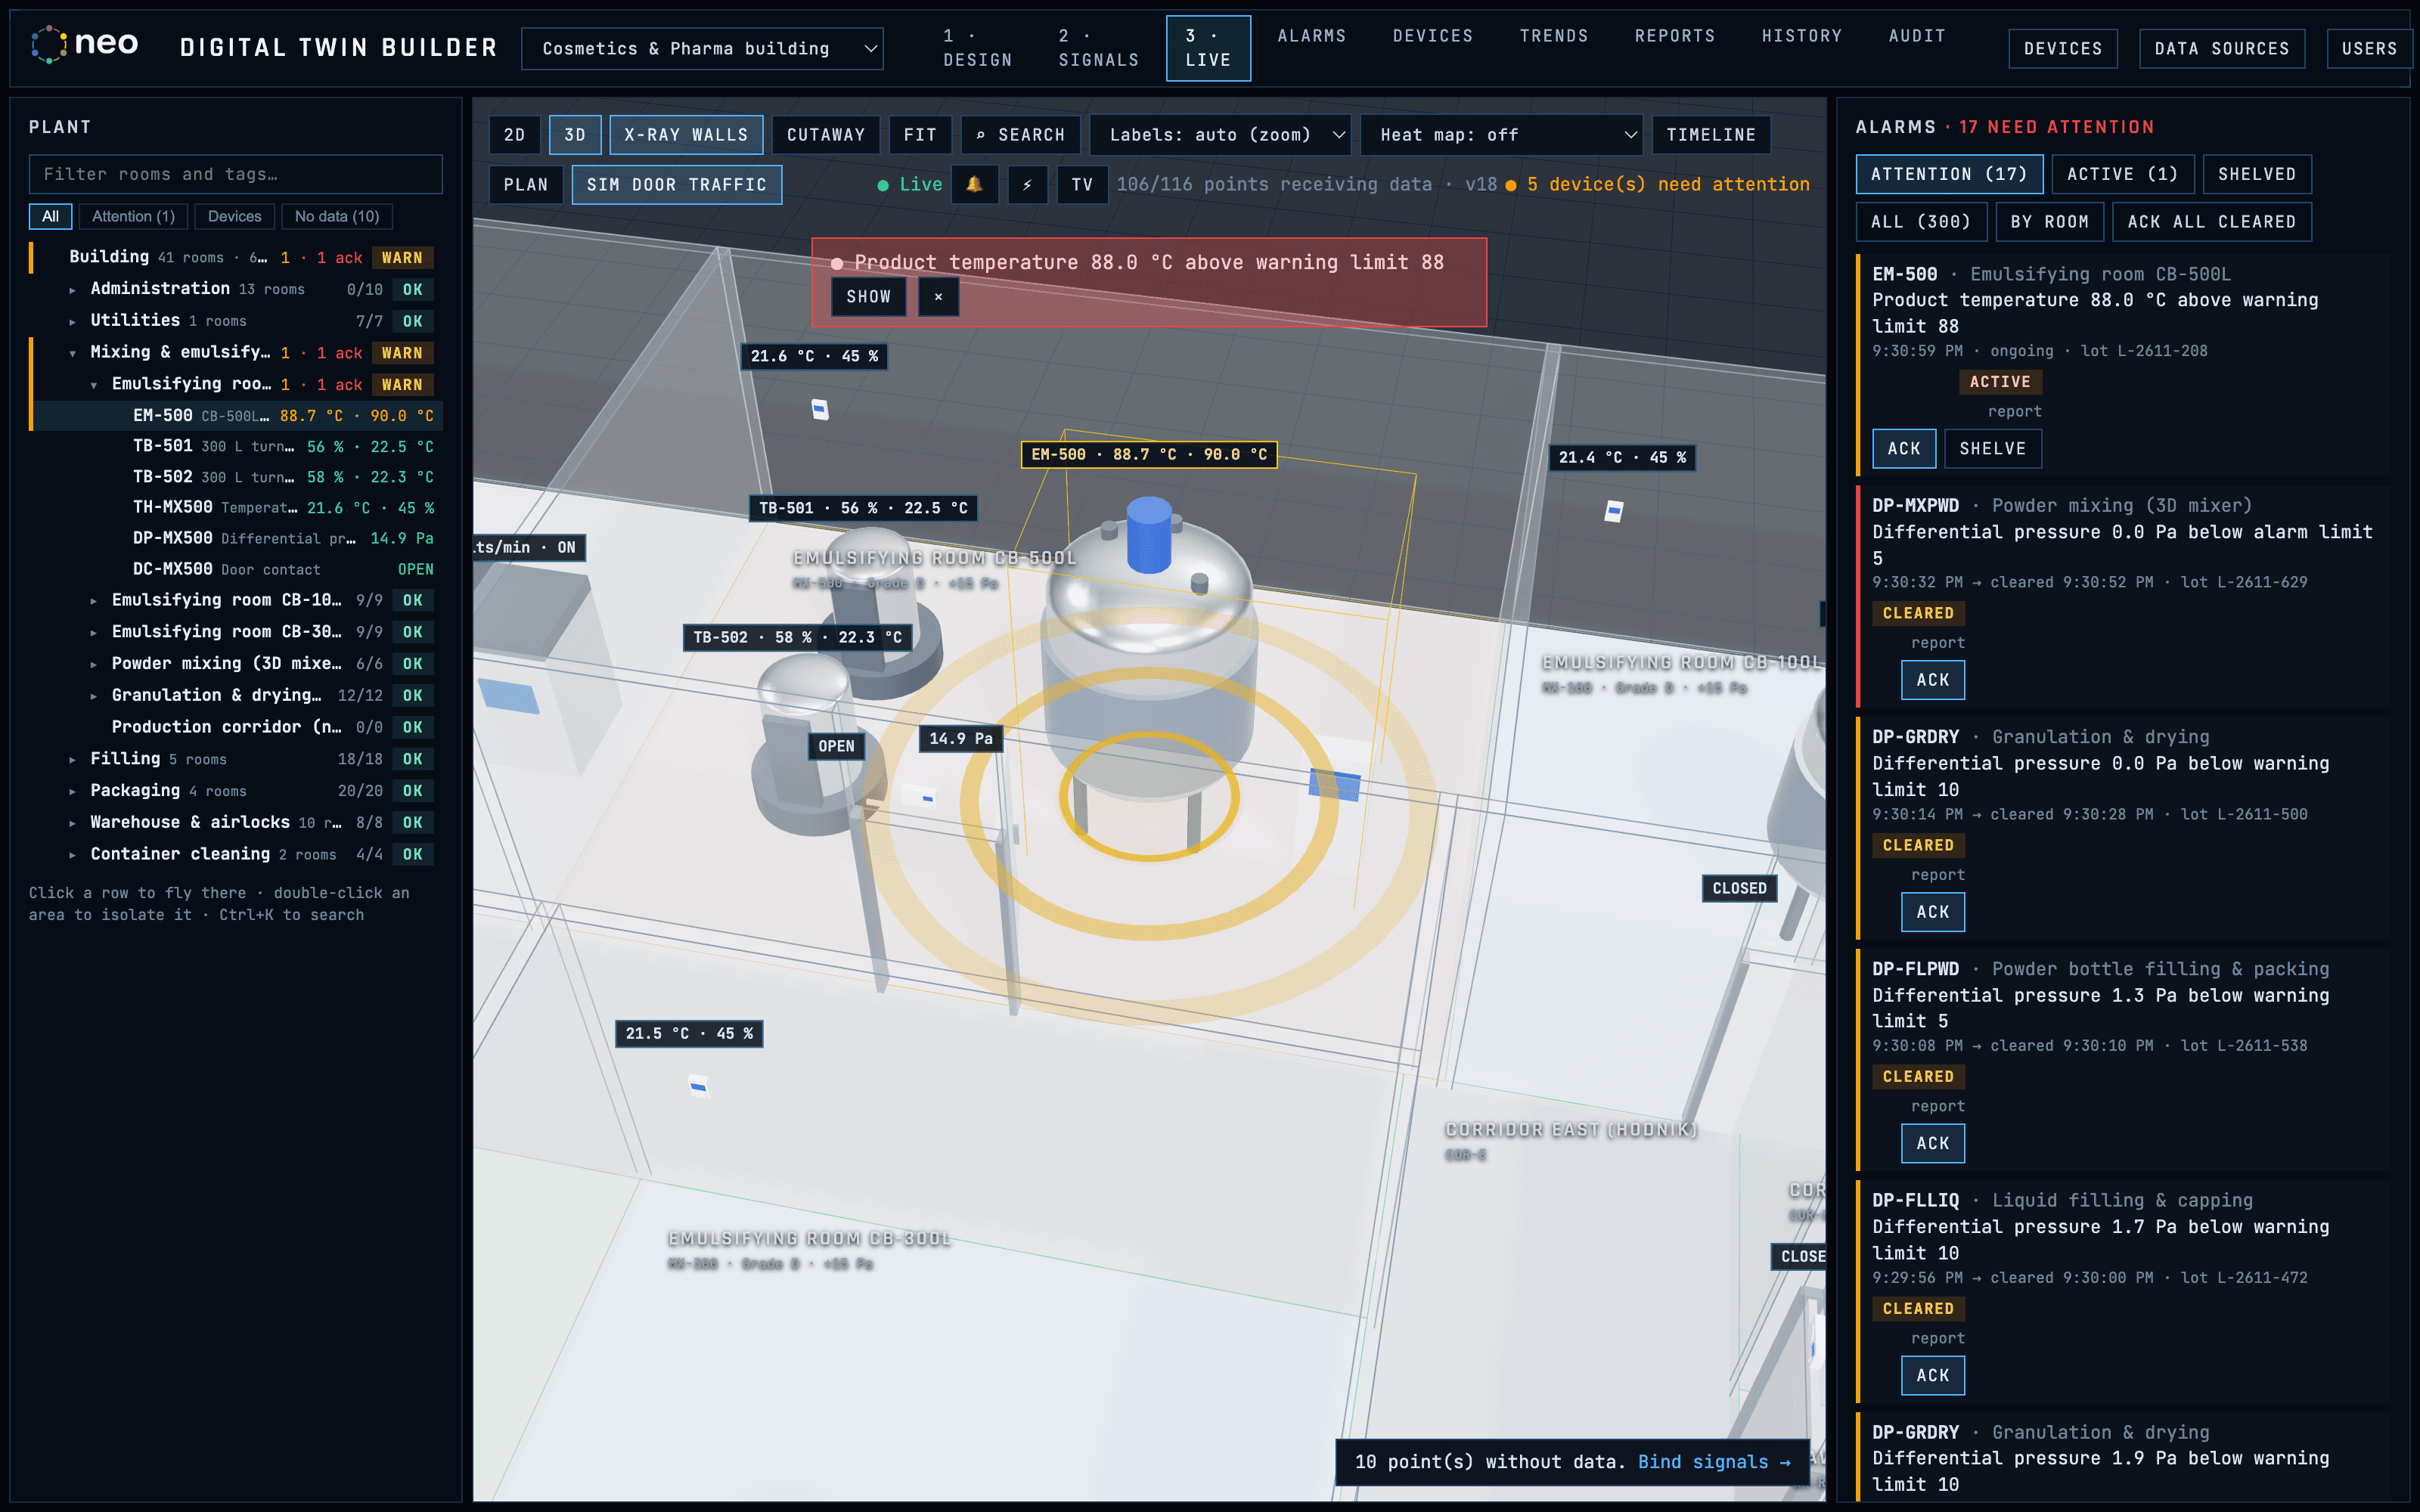
One click on the alarm flies the camera to the equipment. The «X-ray walls» function makes the walls transparent.
For wall displays there is a TV mode that rotates through the floors of a building, or through the site plan and each building. When an alarm comes in, the rotation stops on it and the camera flies to the point. The alarms page also works on a phone.
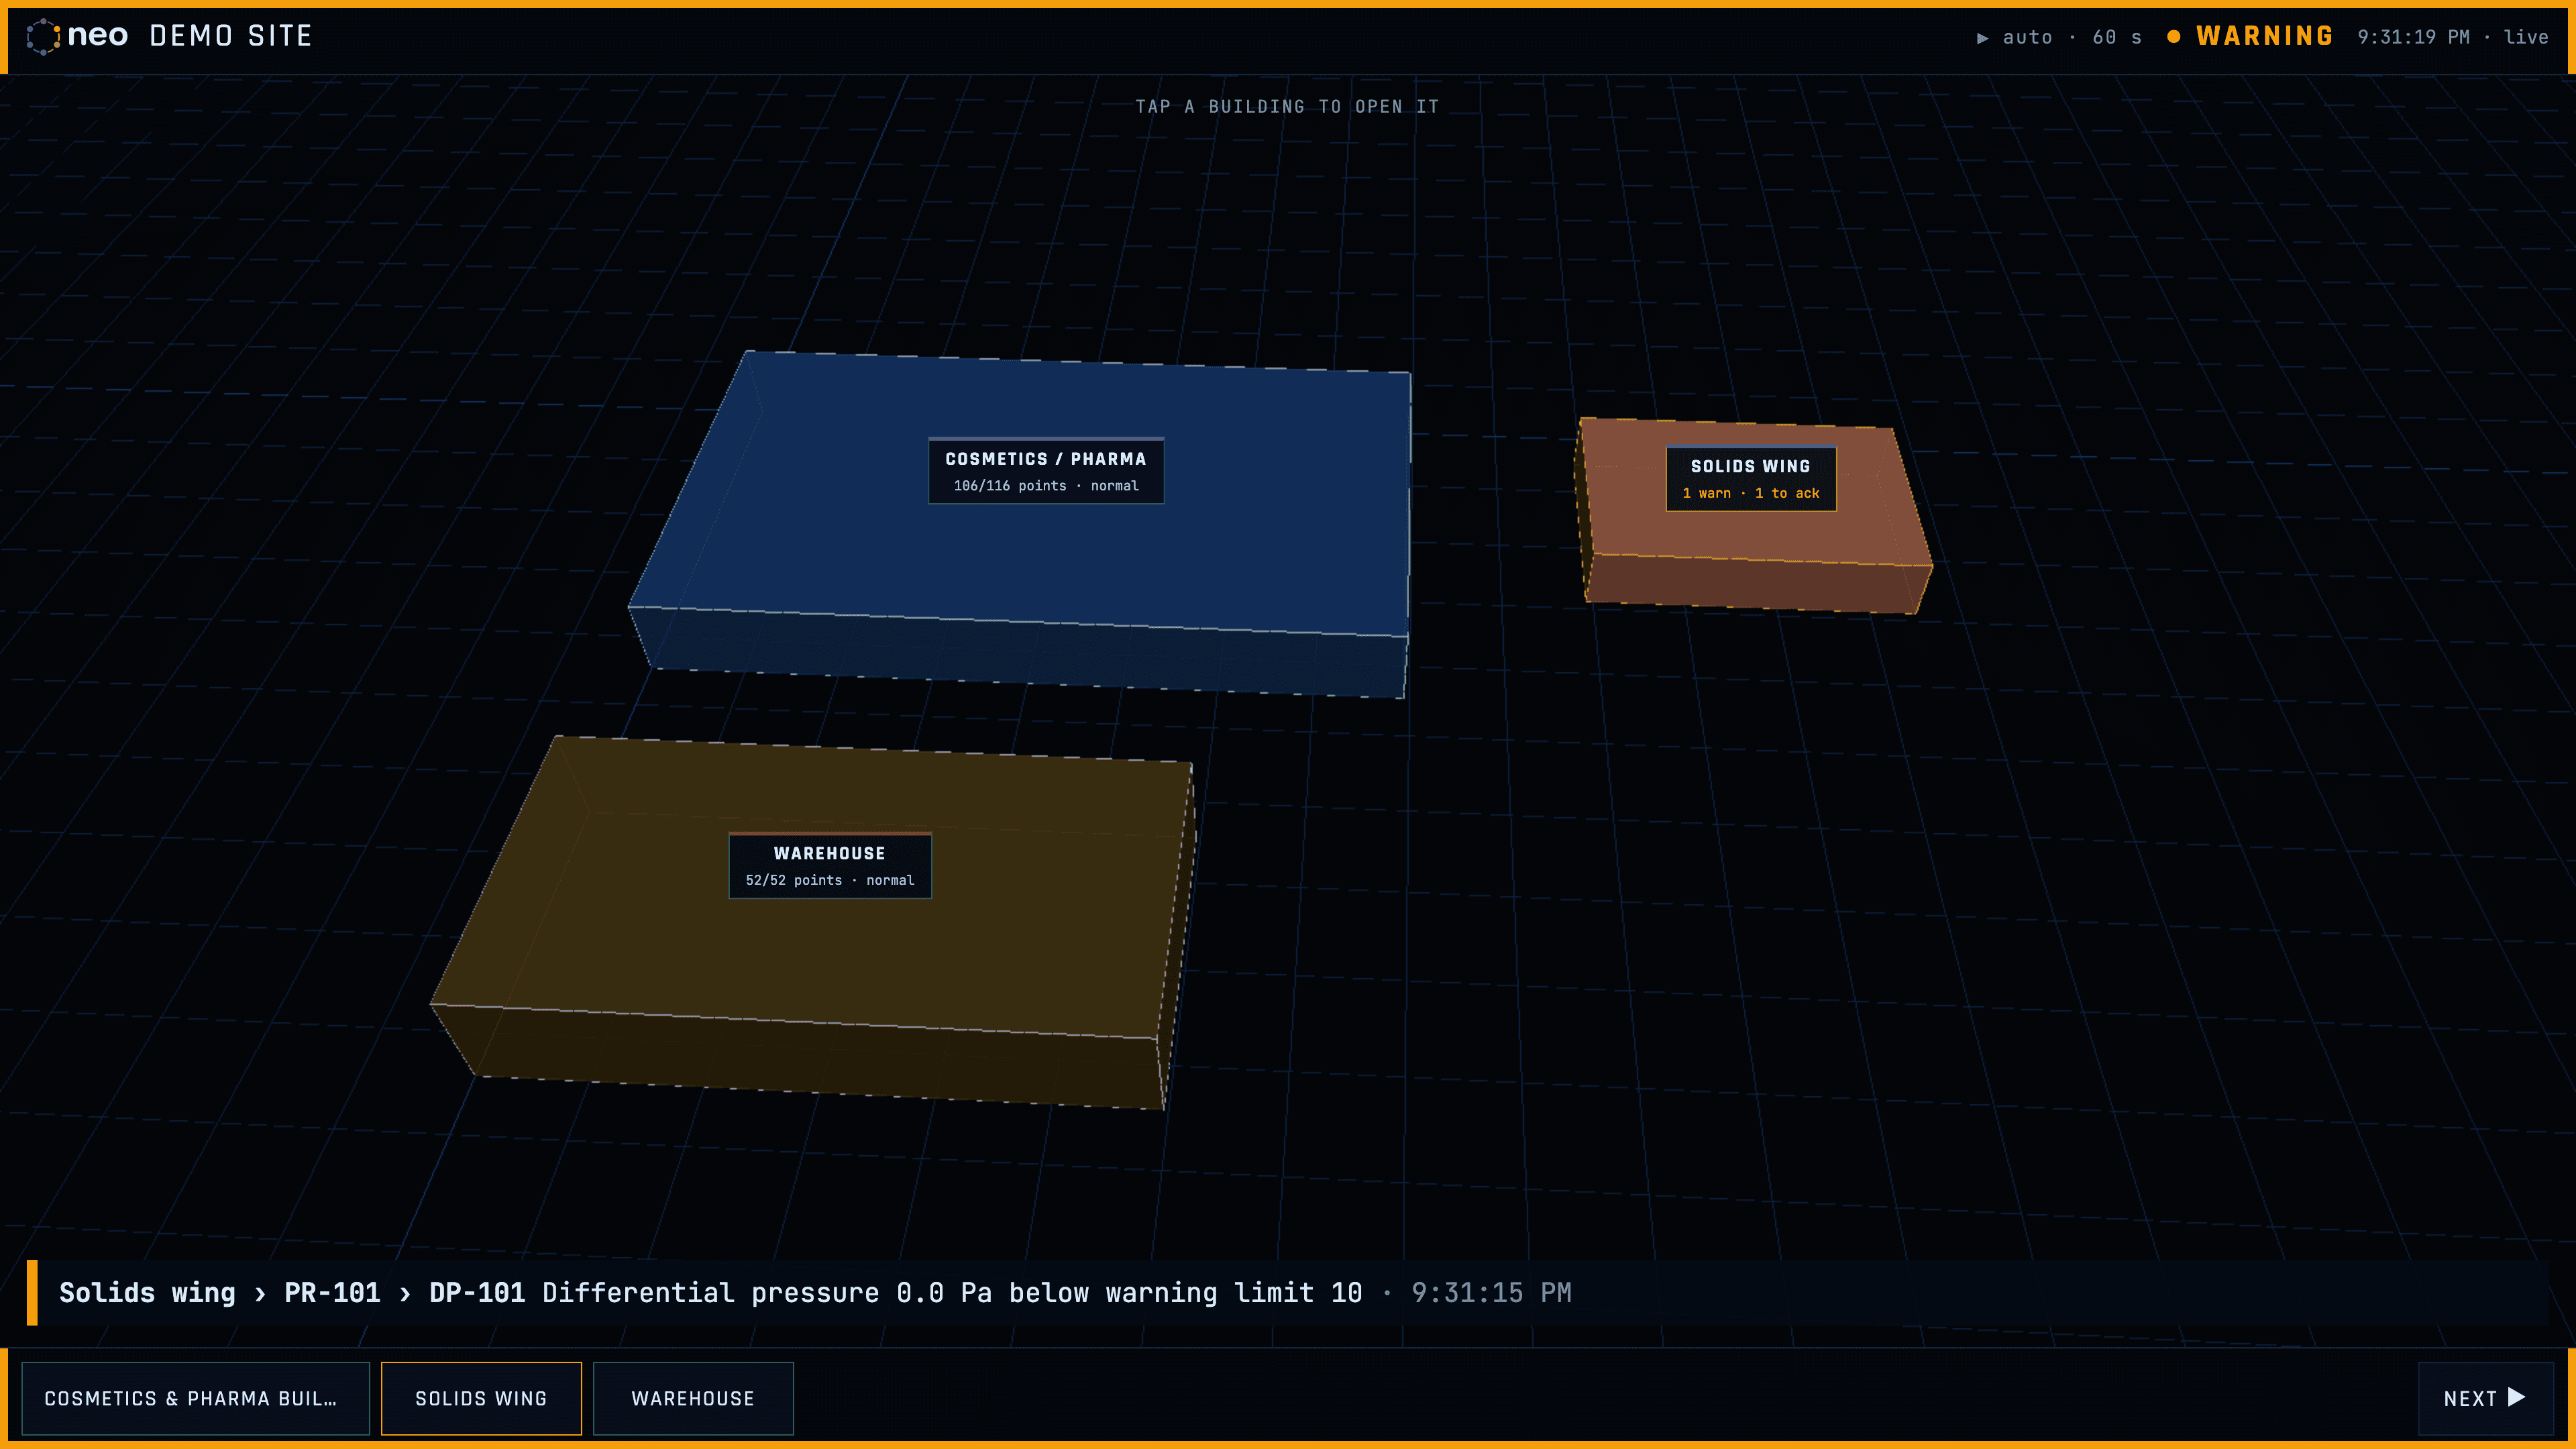
In TV mode, rotation across the buildings stops when an alarm comes in.
Alarms with delay, hysteresis and comment
Each point has warning and alarm ranges, a delay per level and hysteresis. The delay is there so that a short fluctuation does not become an alarm. An example from the default catalogue: a cleanroom's differential pressure only goes into warning after 10 seconds out of range, and into alarm after 15. A normal passage through the door does not alarm. The door contact itself has a separate rule: warning after 30 seconds open, alarm after 60.
The alarm lifecycle is recorded end to end. To acknowledge an alarm, the operator must write a comment, and in practice it is worth defining in a procedure what that comment should contain: the reason and the action taken. If a warning escalates to an alarm, the acknowledgement is reopened. A point under maintenance can be shelved for a number of minutes, with a mandatory reason. When the plant sets the batch in production, every alarm records the batch in progress. All these transitions go into the audit trail.
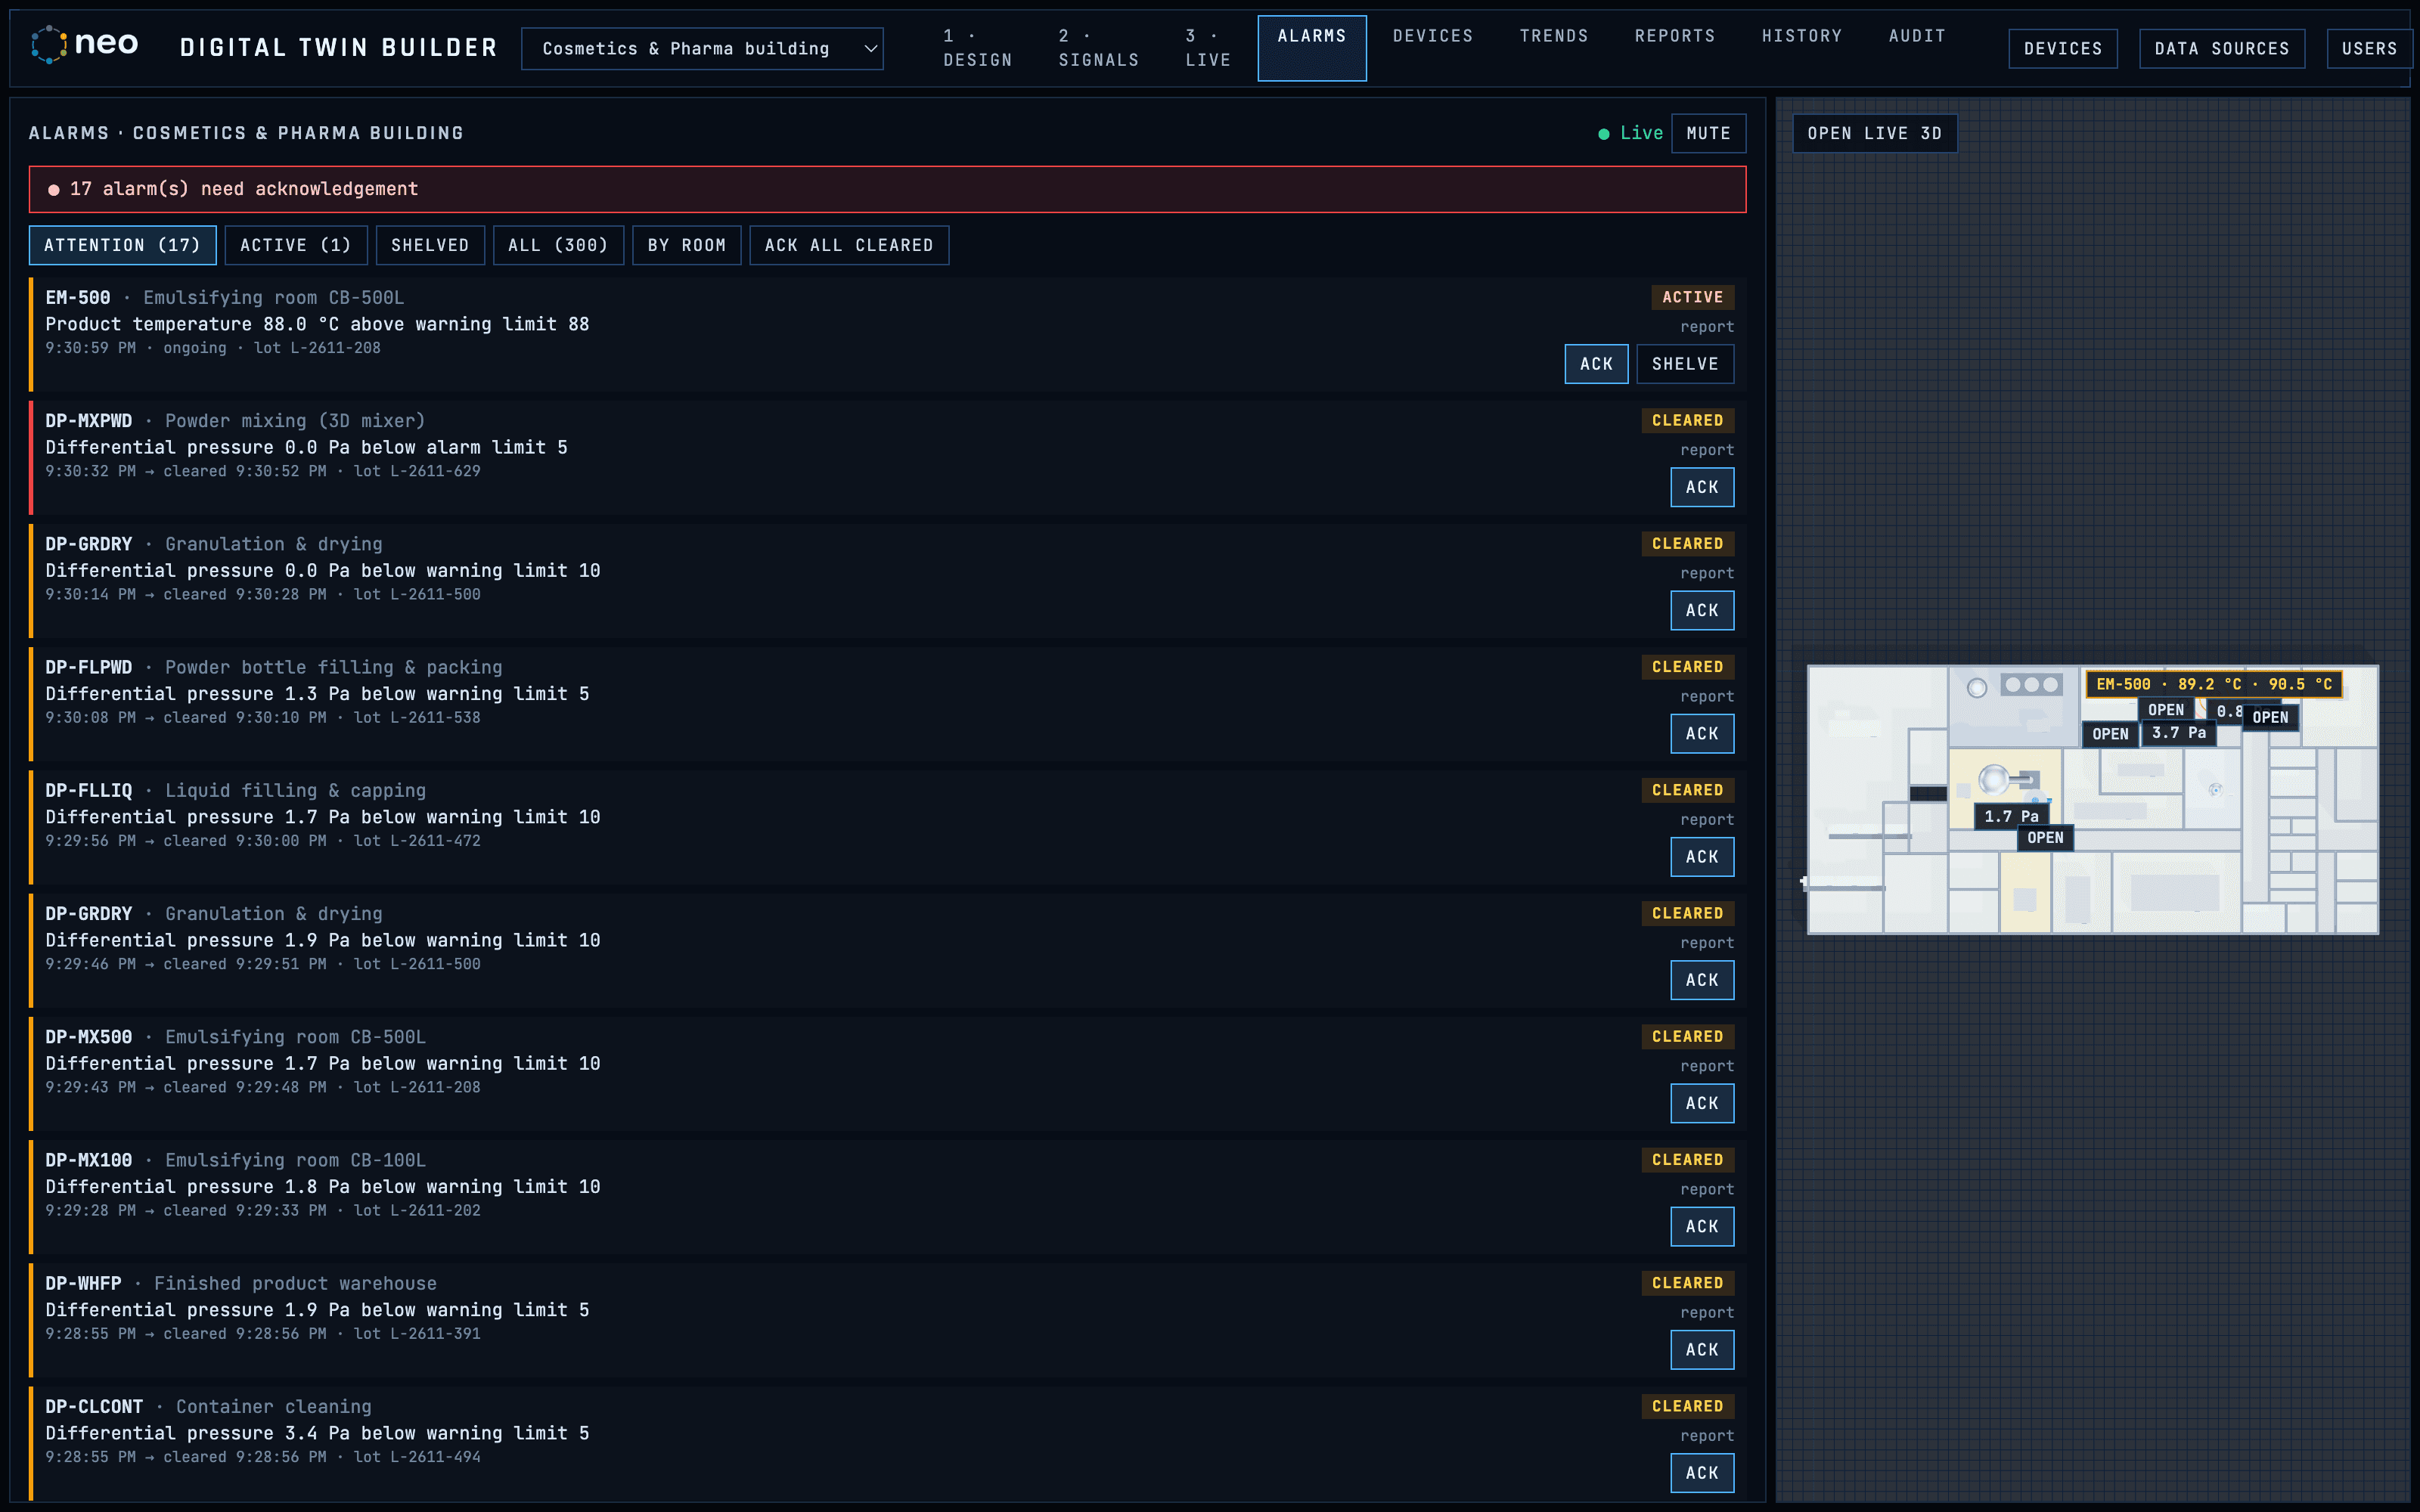
The alarms page, with the 2D plan beside it.
The excursion report
This is where the deviation investigation tends to start. For each alarm, the excursion report brings together the limit crossed, the peak, the time and area beyond the limit, the room's doors, the differential pressure of neighbouring rooms, the model version in force and the lifecycle events with each step's comments, together with the chart of the period. It can be printed with a signature line, and the data series can be exported to CSV. There is also a monthly report per room.
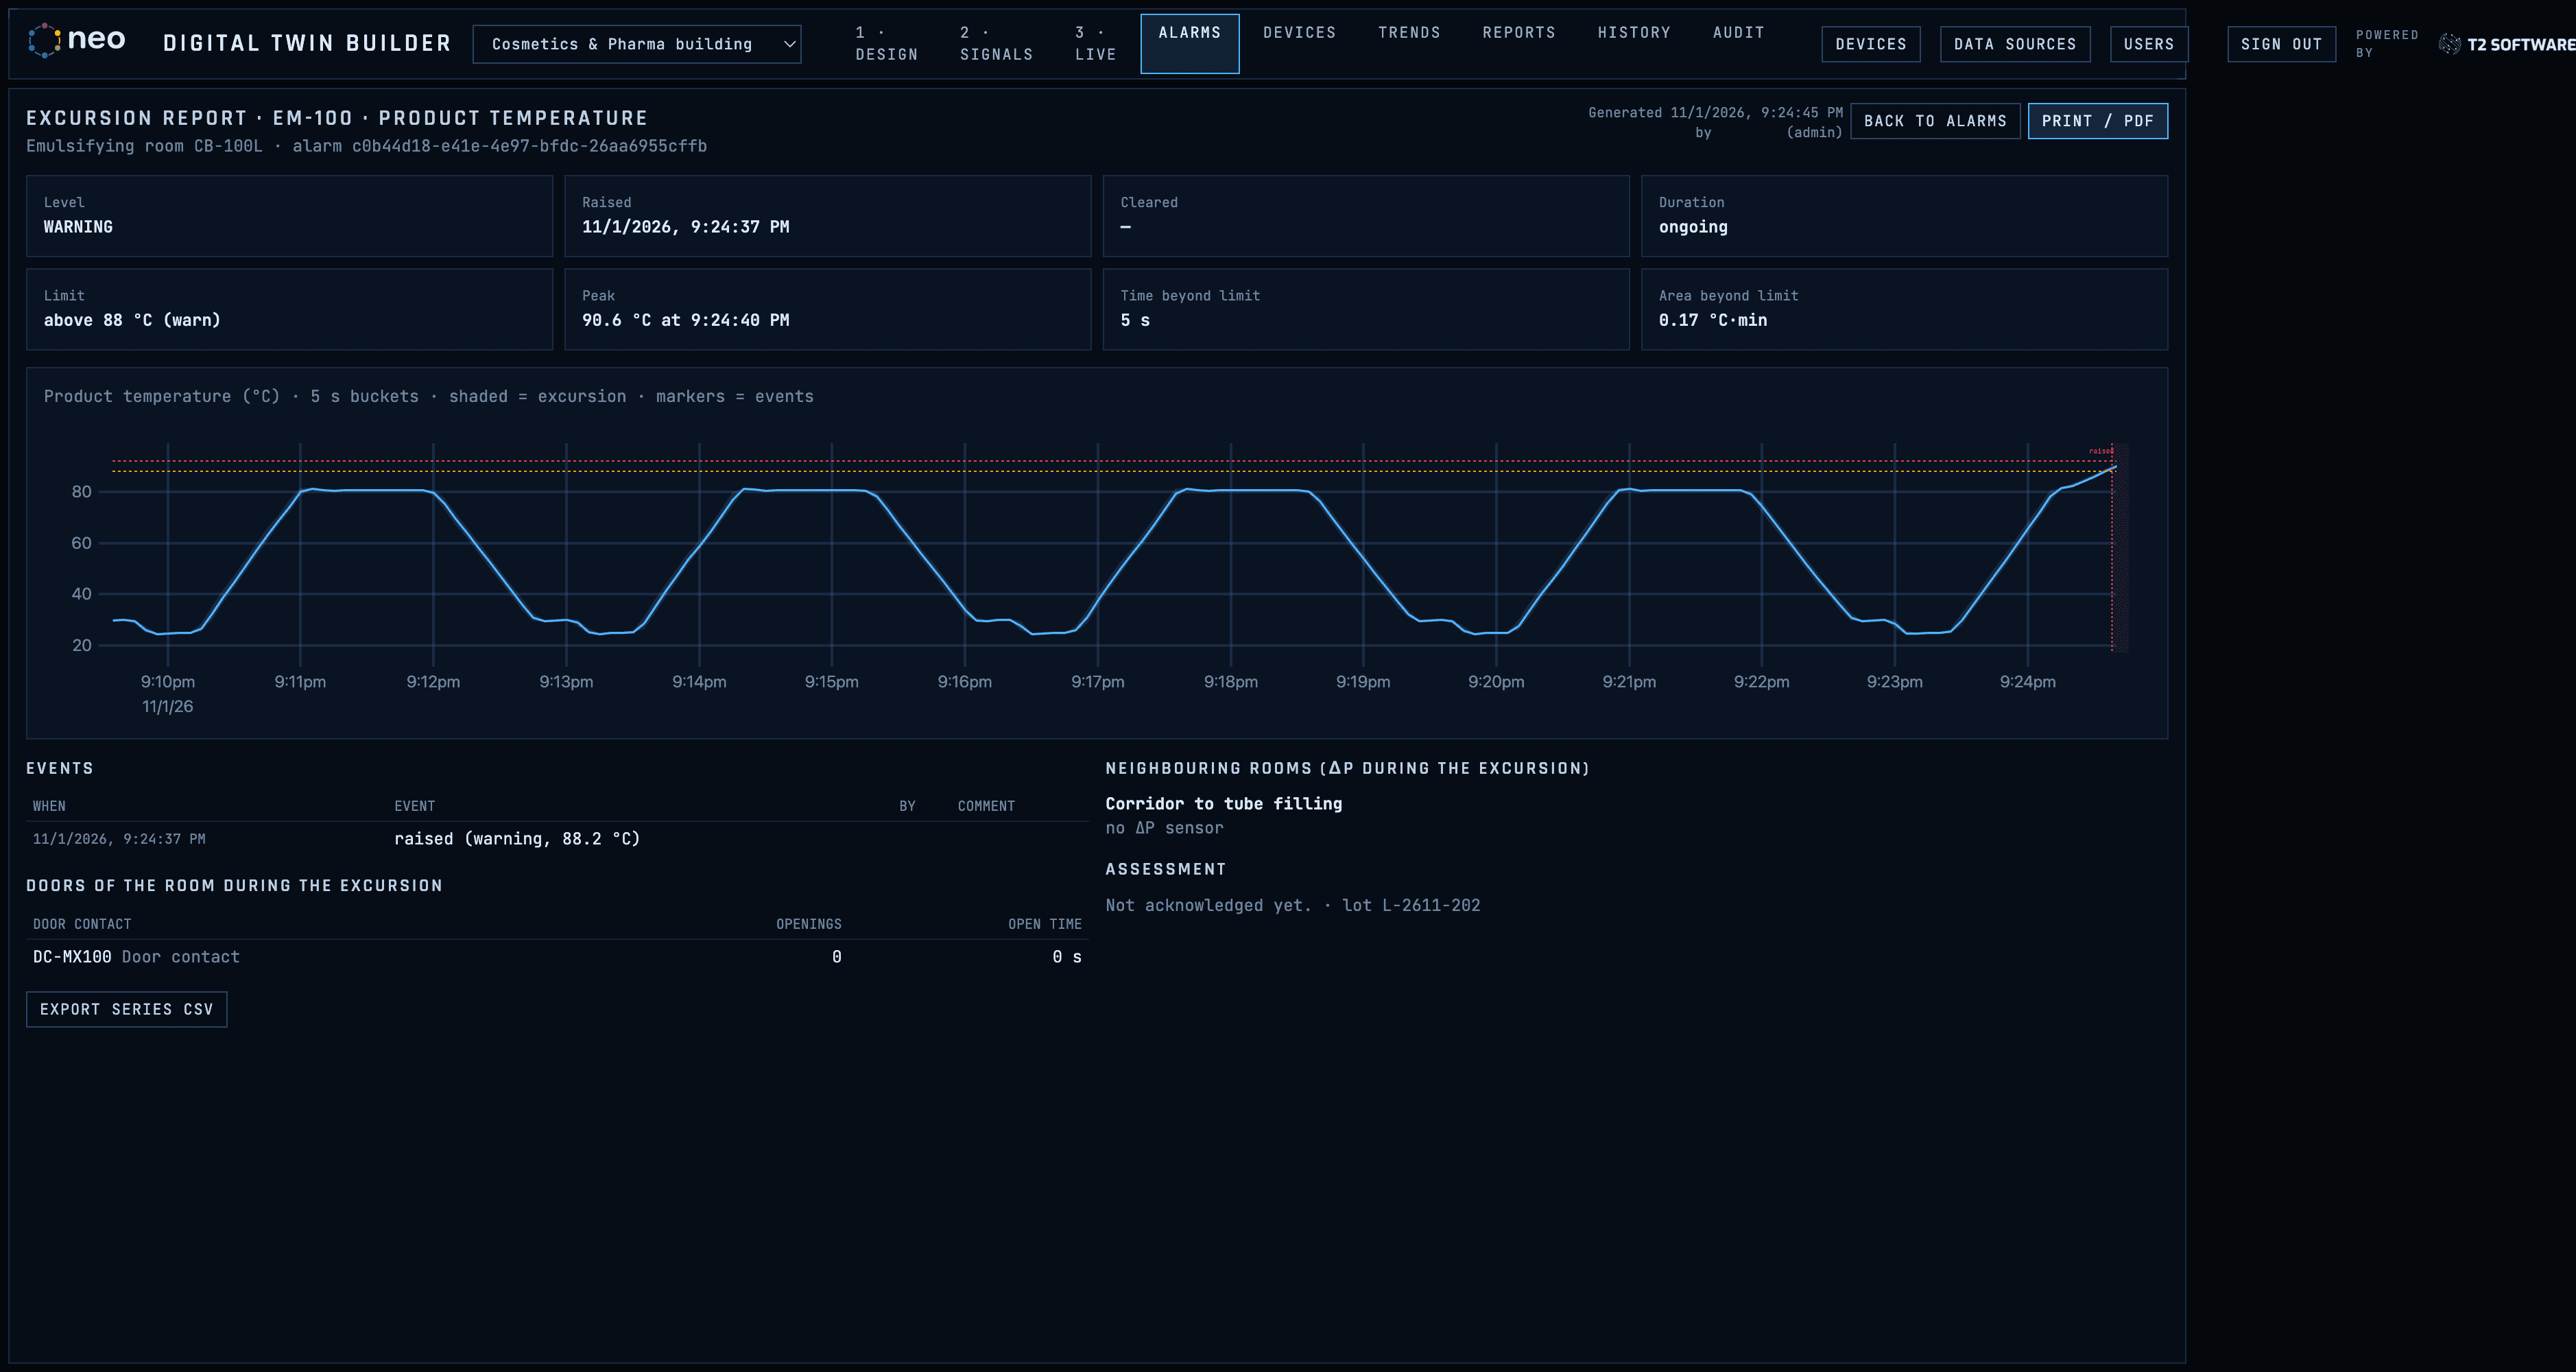
Excursion report: limit, peak, chart of the period and lifecycle events.
This does not replace the investigation, but it changes the starting point. Instead of rebuilding the event from several sources before batch release, the quality team starts from a document that already links the reading, the room, the shift's response and the batch.
Versions, signature and audit
Changes to the model are made in a draft and only take effect once published. Each publish creates a version, with history, comparison between versions and restore. The plant can require an electronic signature on publish, with password and reason. This applies to limits and delays as well: changing a limit means publishing a new version.
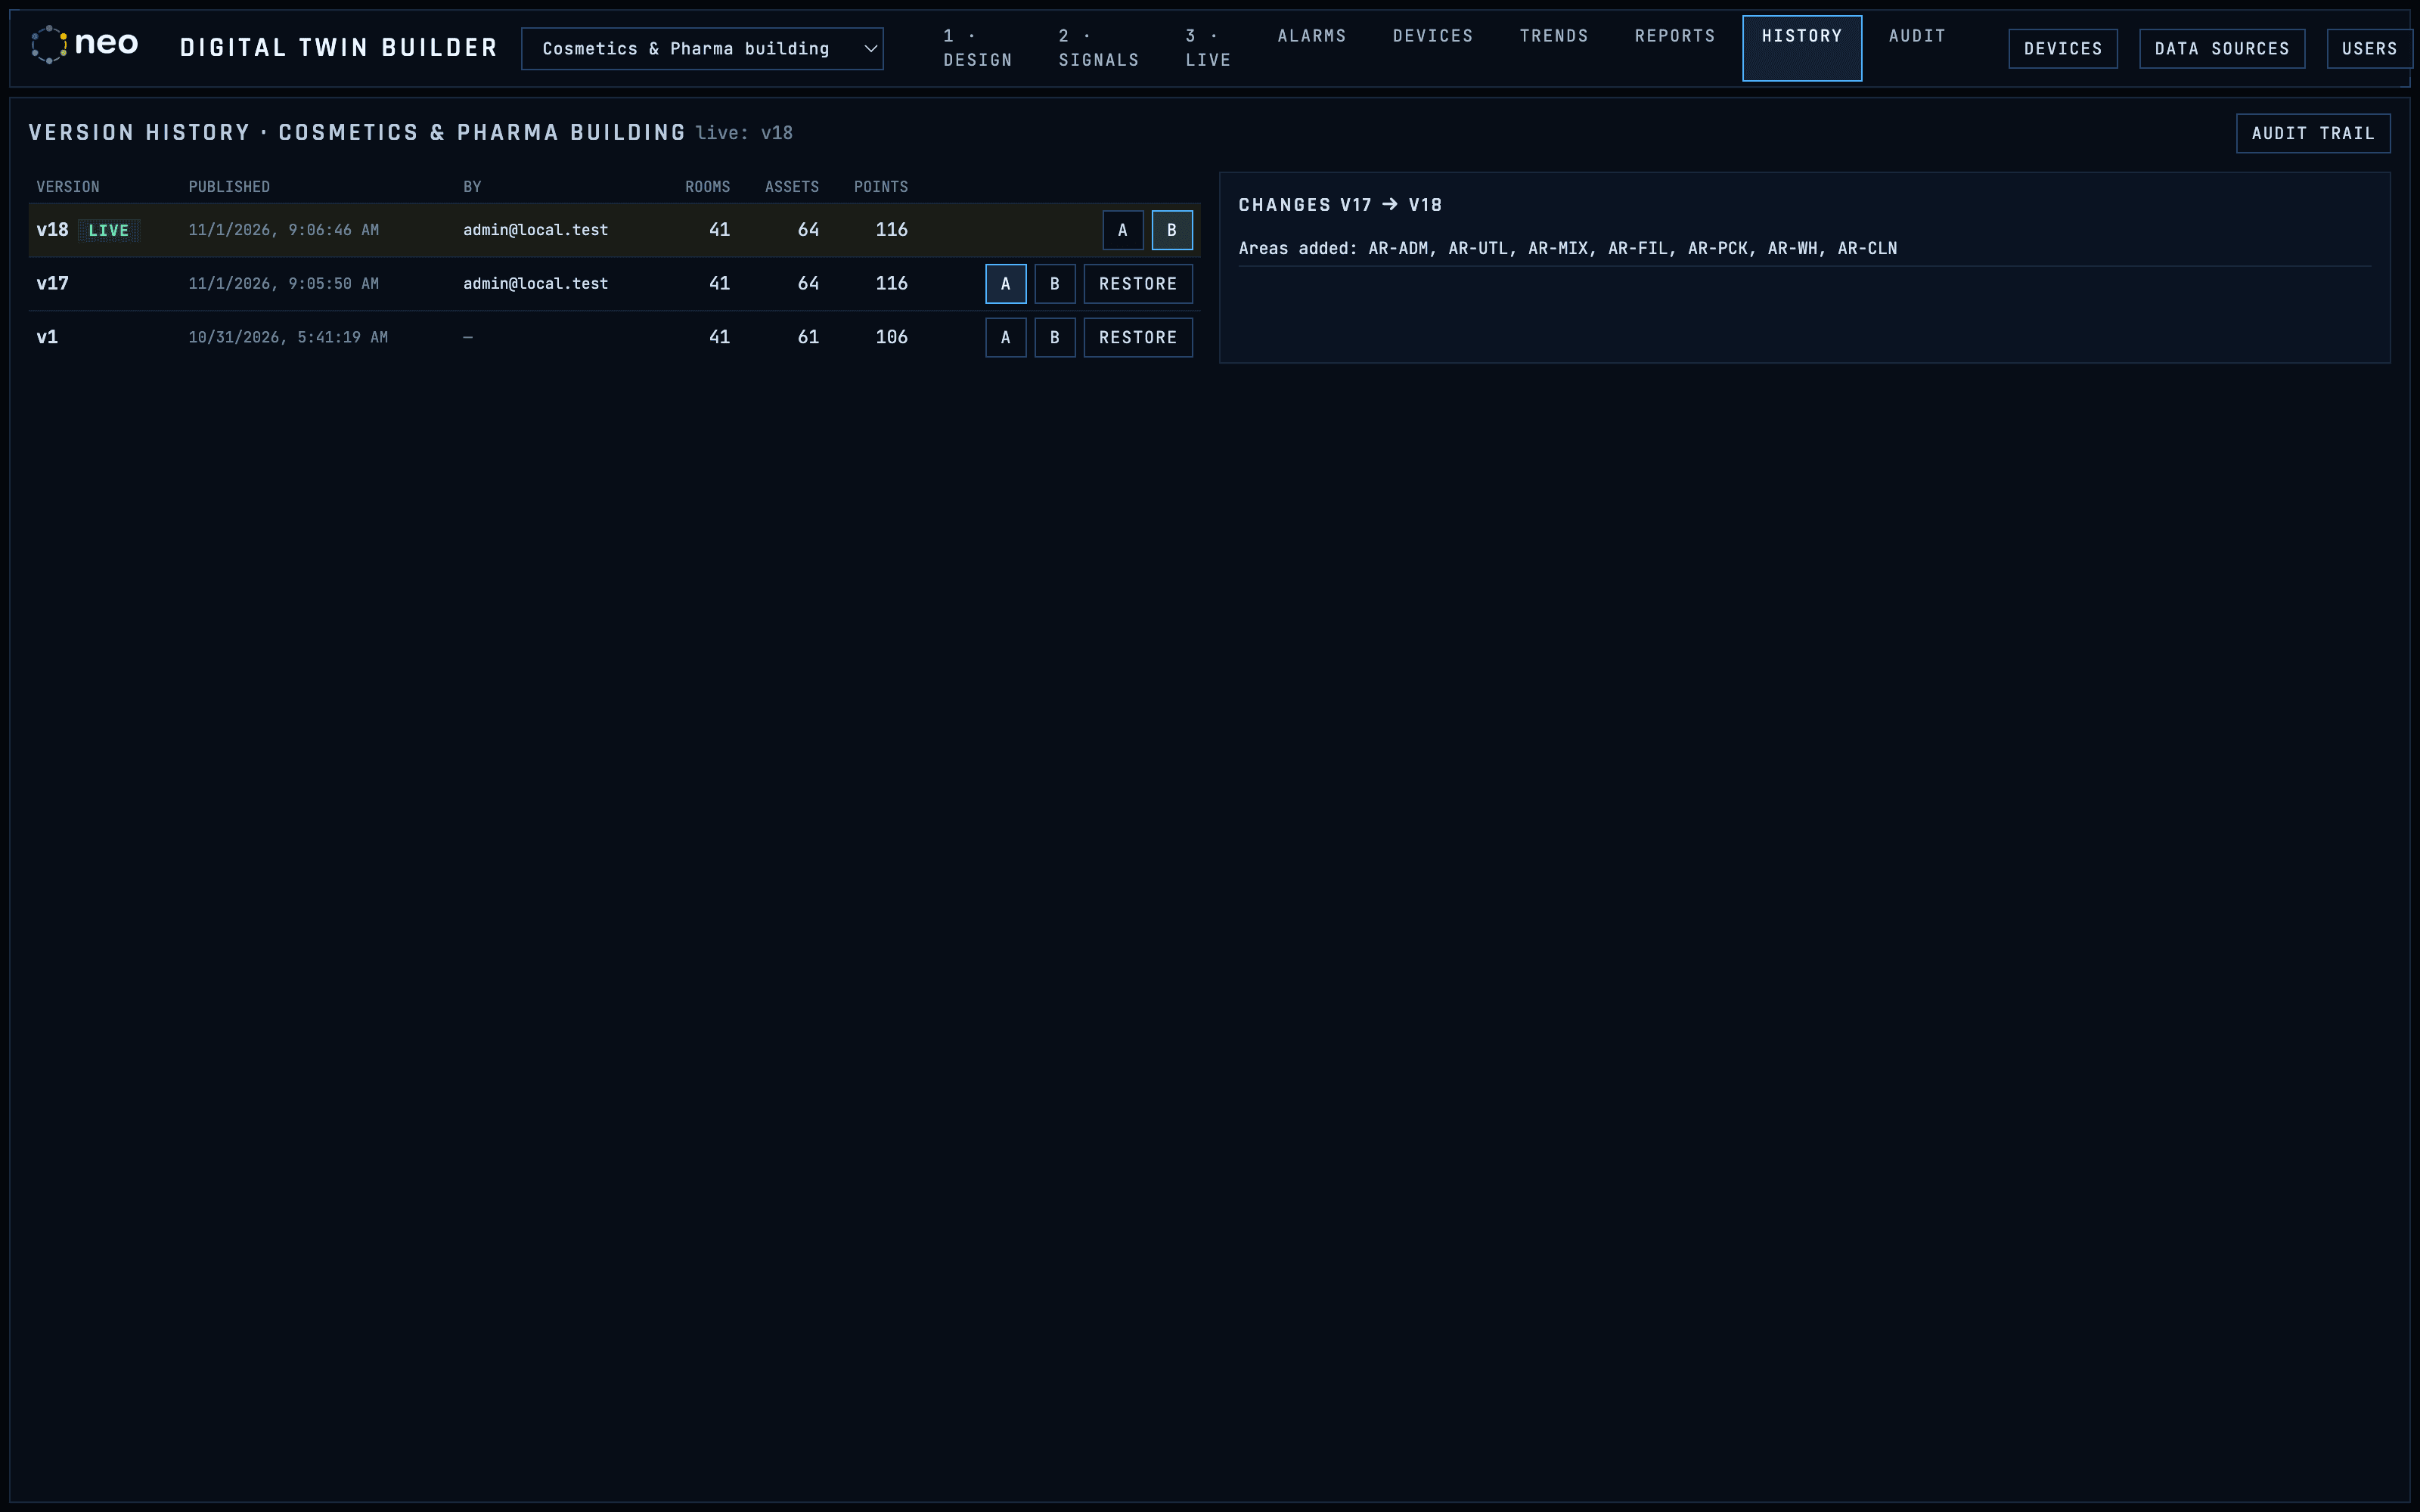
Each publish creates a version, with history, comparison and restore.
Access is by role (viewer, operator, engineer and admin) and by plant, with sign-in via Google, Microsoft Entra ID or local accounts. In the pilot deployment, the module runs on the plant's own infrastructure, on a single container host. It was designed with 21 CFR Part 11 and EU Annex 11 expectations in mind.
What still sits with the plant
Some definitions do not come from the software, and it is better to make them clear before deployment.
- Notifications. Today alerts are on screen: sound, banner, a counter on the browser tab and the TV mode. Email, push and WhatsApp are planned. In the meantime, the module can publish alarms over MQTT, and the plant can forward them to the notification system it already uses.
- Retention. By default, telemetry is kept for 90 days; models, alarms and the audit trail are kept indefinitely. If this data supports a deviation investigation or batch release, the required period is usually much longer than 90 days. If the plant's procedure requires a longer period for monitoring data, this needs to be configured and verified.
- Validation. NEO Digital Twin does not include a qualification package (IQ/OQ/PQ). Validation for GMP use is the customer's responsibility, according to the intended use.
- Heat map. The heat map is an interpolation between sensors and helps direct attention. It does not replace a thermal mapping study.
- Signature on the report. The excursion report's signature line is for a signature on paper or PDF; the module's electronic signature is the one on version publish.
A question for your plant
Think of the last monitoring deviation investigated at your plant. How long did the team take to answer, with evidence, four questions: when did the value leave its limit, who saw it, what was done and which batch was in production?
If the answer depended on piecing together several sources, it is worth looking at how NEO Digital Twin organises that record from the first warning.
Practical writing on GxP, MES, data integrity and shop-floor systems. A few times a month, no noise.